Imagine you’re running a live streaming service, an OTT platform, or broadcasting live events, and you want to ensure your viewers are getting a smooth, high-quality experience. How do you know if they’re getting the service they expect? The 5centsCDN Analytics Dashboard provides timely, up-to-date data on your CDN’s performance, empowering you to make impactful decisions that enhance viewer experience, control costs, and deliver top-tier content.
Why CDN Analytics Matter for Streaming and VOD
For OTT platforms, Live TV, and other streaming services, CDN analytics are essential to:
- Optimize Content Delivery by identifying and resolving potential issues swiftly.
- Control Costs through bandwidth monitoring, enabling you to deliver quality without overspending.
- Understand Your Audience by revealing where, when, and how they engage with your content.
- Make Strategic Decisions by analyzing viewer trends and adjusting delivery strategies to match their preferences.
Exploring the 5centsCDN Analytics Dashboard
5centsCDN Analytics Dashboard offers two powerful sections – Summary and Traffic – each packed with tools that support quality streaming for your viewers. Here’s how each feature can be leveraged for VOD and live-streaming businesses.
1. Summary Section: Your Overview for Content Delivery

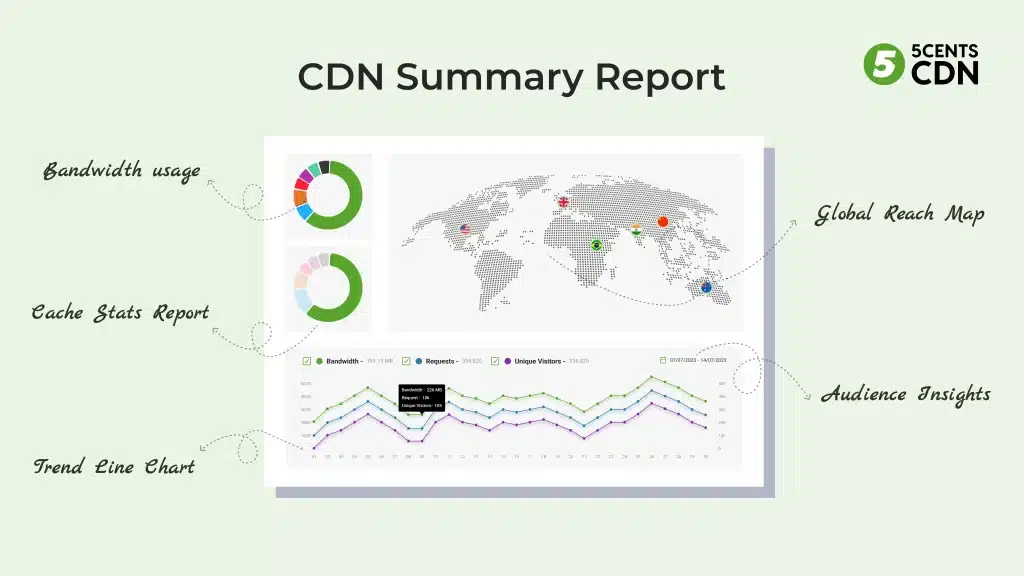
CDN Summary Report
Looking for a daily check-up on your content’s performance? The CDN Summary Report shows bandwidth usage, requests, unique visitors, and cache efficiency, providing timely insights to help you spot patterns and address issues as they arise.
- Benefit for Live Streaming (Live TV, Church, Events): Spot spikes in requests the same day to manage high viewership and scale resources, preventing interruptions.
- Benefit for VOD (OTT Platforms, TV Channels): Track daily usage and network demands, allowing you to adjust resources and deliver high-quality playback.
Cache Stats Report
Need faster loading times for your content? This report offers a breakdown of cache hits, misses, stale content, and revalidations, so you can fine-tune caching for better speed.
- Benefit for Live Streaming: With timely data on cache performance, you can reduce buffering, providing smoother streams during live events.
- Benefit for Websites: Optimized caching helps load times, improving user experience and reducing bounce rates.
Trend Line Chart
Want to know how viewer engagement changes over time? The line chart displays trends in bandwidth usage, requests, and unique visitors, letting you spot patterns over any time frame.
- Benefit for Live Streaming: Identify peak times to scale server capacity in advance, ensuring a stable stream for high-demand events.
- Benefit for VOD: Understand high-demand periods to optimize resource allocation, keeping popular shows accessible without delay.
Global Reach Map
Curious where your viewers are tuning in from? The Global Reach Map displays CDN usage by country and Points of Presence (PoPs), giving insights into where your audience is located.
- Benefit for Live Streaming and VOD: Spotting high-traffic regions lets you adjust your setup to improve stream quality and reduce latency for viewers in those areas.
Weekly Usage Heatmap
Want to see peak traffic times throughout the week? The heatmap reveals daily and hourly bandwidth patterns, offering a weekly view of your audience’s viewing habits. This provides valuable insights into your audience’s current viewing behavior, which can inform various operational and strategic decisions.
Benefit for Live Streaming:
- Identify peak viewing times: Understand when your audience is most active to gauge the potential reach of live events or broadcasts.
- Optimize resource allocation: Ensure sufficient server capacity during peak hours to maintain a smooth streaming experience.
- Schedule maintenance strategically: Avoid conducting maintenance or updates during periods of high traffic to minimize disruptions.
Benefit for VOD:
- Analyze content consumption patterns: See when viewers are most likely to engage with your VOD content.
- Inform content release strategies: While the heatmap doesn’t predict optimal release times, it provides context on existing viewer habits. Consider A/B testing different release times to determine what works best for your audience.
- Optimize CDN resource allocation: Ensure your CDN is prepared to handle increased demand during peak viewing hours.
Audience Insights
Looking to tailor content to specific devices and platforms? Audience Insights break down data by browser, OS, device type, and HTTP status codes, helping you understand how viewers access your content.
- Benefit for Live Streaming: Optimizing for popular devices improves playback quality, ensuring a smooth experience for viewers.
- Benefit for VOD and Websites: Tailor delivery to preferred devices to reduce drop-off rates, especially for mobile audiences.
2. Traffic Section: In-Depth Audience Insights

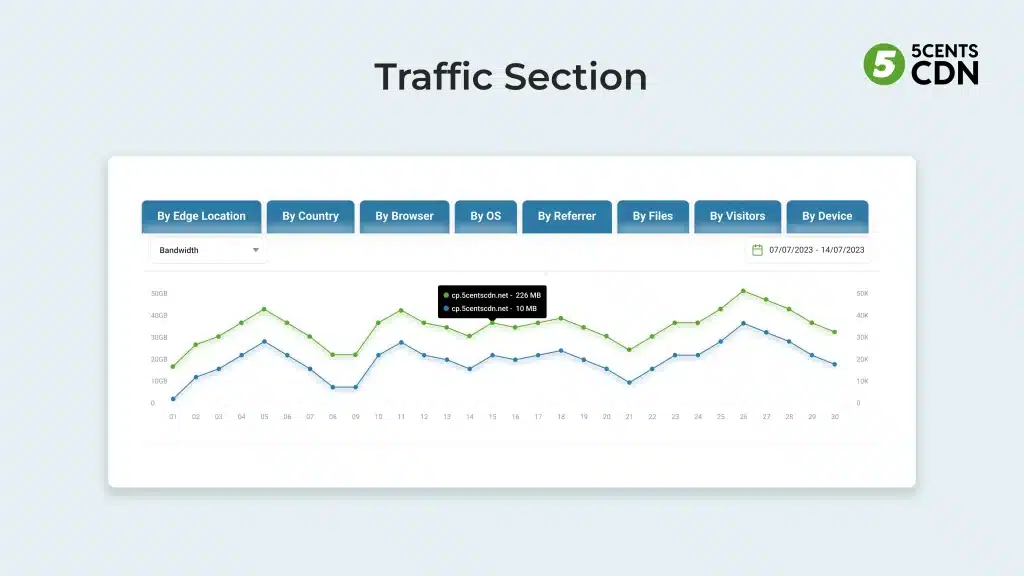
With the Traffic Section, you get detailed analytics on traffic behavior across various dimensions, providing insights specific to OTT platforms, TV channels, and live-streaming events.
Traffic by Edge Location and Country
Want to pinpoint where your audience is tuning in? See traffic by Points of Presence (PoPs) and country to understand viewer locations.
- Benefit for Live Streaming: By identifying popular regions, you can optimize resources and reduce latency for high-demand events.
- Benefit for VOD: Recognizing popular areas helps you optimize performance in key regions, providing a smoother experience for viewers.
Traffic by Browser, OS, and Device
Need compatibility across platforms? Get insights into which devices, browsers, and operating systems your audience prefers, ensuring compatibility.
- Benefit for Live Streaming and VOD: Optimizing for high-usage devices can reduce playback issues, ensuring content reaches more viewers seamlessly.
Traffic by Referrer
Want to know where your traffic comes from? The referrer metric shows where traffic originates, helping you focus your marketing efforts.
- Benefit for VOD and Websites: Focusing on top traffic sources increases engagement by reaching your audience through high-performing channels.
Traffic by Files
Curious about your most popular content? Traffic by Files shows which content is getting the most engagement, helping you prioritize resources for those assets.
- Benefit for VOD: Knowing which videos are popular lets you allocate resources to keep high-traffic content accessible and high-quality.
Traffic by Status Code
Want to identify and resolve issues quickly? Status codes show potential errors, such as 404s or 500s, letting you fix issues before they affect users.
- Benefit for Live Streaming and Websites: Quickly identifying errors helps maintain service quality, ensuring streams run smoothly and pages load quickly.
Maximizing the Value of CDN Analytics
The 5centsCDN Analytics Dashboard offers timely insights that help you:
- Reduce Latency by resolving potential bottlenecks before they disrupt your content delivery.
- Improve Website Performance with optimized caching and faster load times, creating a seamless experience.
- Increase Viewer Engagement by understanding what your audience values and delivering content tailored to them.
- Control Costs by closely monitoring bandwidth and optimizing usage, keeping your expenses in check.
With the 5centsCDN Analytics Dashboard, you’re not just delivering content; you’re delivering quality experiences that resonate with your audience.